Anypoint Monitoring Custom Dashboards
A platform service for Mulesoft Anypoint users to easily build charts and dashboards that adapt to their specific monitoring use cases.
Role & Responsibilities
Sole lead designer on this project
Lead brainstorming workshops with designers and developers
Ran user interviews with help of PM
Created a communication channel between product and SE team on Slack
Designed wireframes and high fidelity prototypes with Figma
Timeline
March 2023 - June 2024
Custom Dashboards is a powerful tool. However, users demonstrate low adoption rates. Why?
Although Anypoint Monitoring has an established presence, its usability and accessibility remain suboptimal.
The absence of an independent chart exploration features reduces the incentive for users to use Custom Dashboards.
Querying is very challenging and the current experience does not support the conventional mental model of querying.
High friction user journey—current interaction design for building a dashboard is very manual and tedious.

Design Process
-
Play around with Sandbox environment to figure out how users would set up their dashboards.
-
Understand user’s mental model and confirm some hypotheses from my product audit. This part was pivotal in helping me design the information architecture
-
Worked alongside the Sales Engineering team to get feedback on Custom Dashboard and Chart Interactions
-
Finalize design decisions and commit to building MVP.
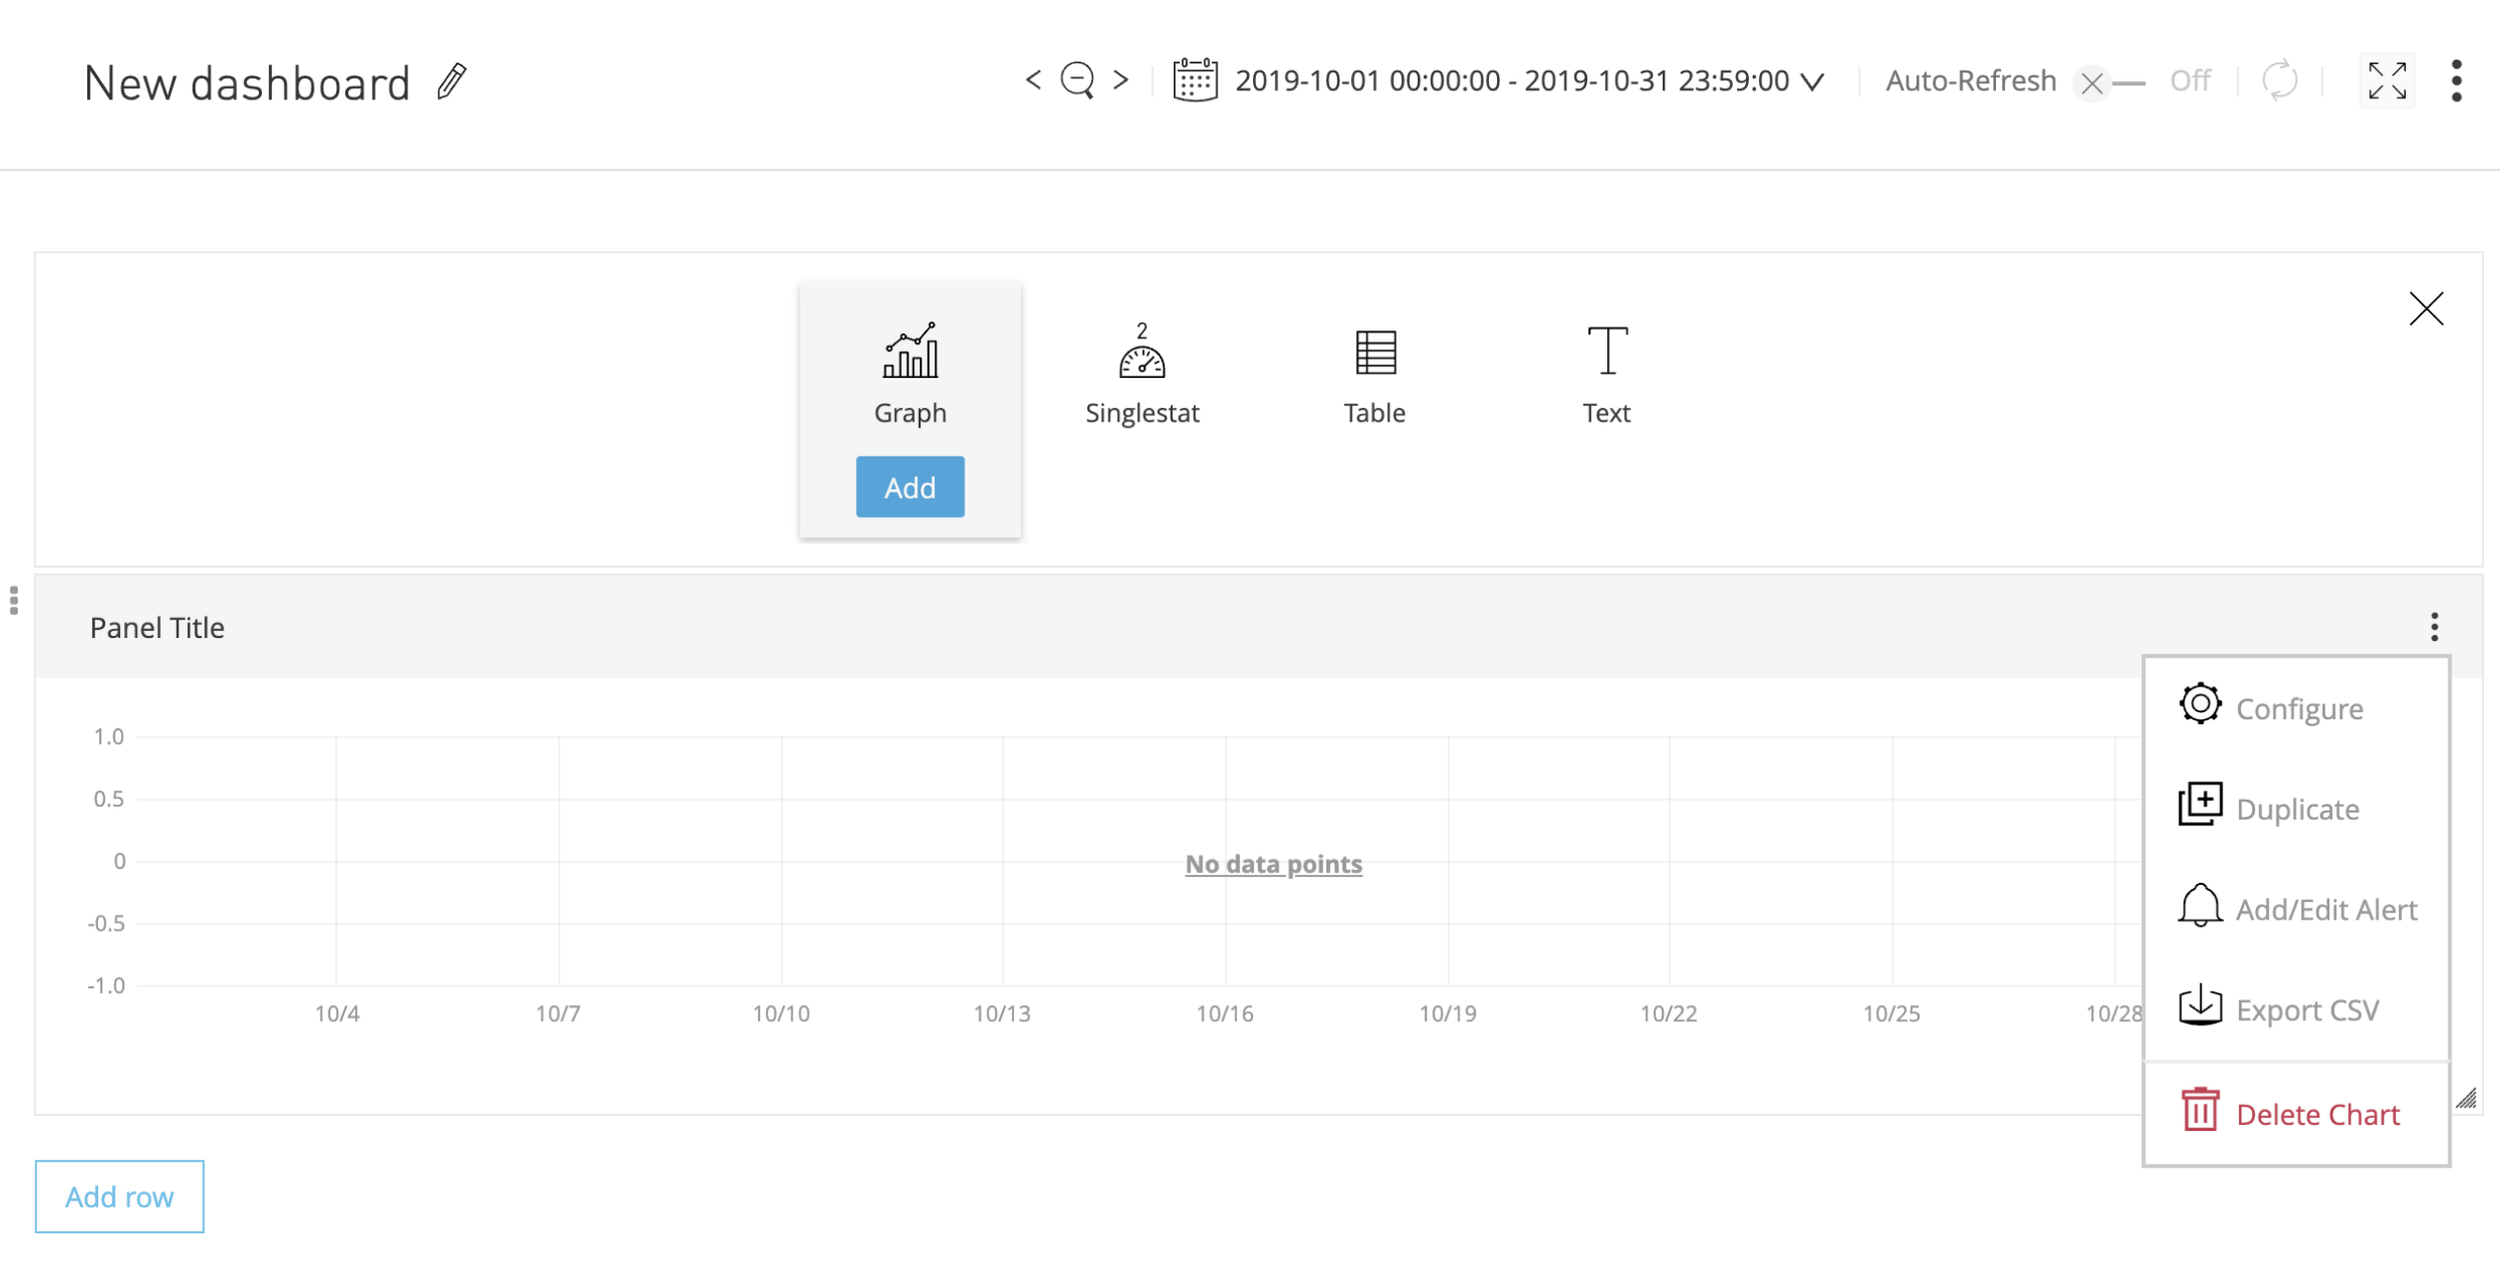
Product Audit
Before getting started, I decided to explore what the existing experience feels like. Turns out, a lot of the functionality is powerful, but the information architecture doesn’t make sense.


In order for the user create a custom chart, they must first create a Dashboard. This feature is highly valuable, but not accessible.
The query builder doesn’t support the user’s mental model. Although it supports the general syntax, users prefer having a freeform/IDE-like format to querying.
Research
After doing the product audit, I was able to come up with a couple of hypotheses about Custom Dashboards. It seems that the tool is quite powerful, but it isn’t accessible. I wanted to better understand why our users are not utilizing Custom Dashboards, so we set up some interviews with a few customers.
Let’s also try to understand who are typically Dashboard users?
Who uses Custom Dashboards?
From user interviews, we found that majority of roles are technical IT/Dev Ops people, but on the other hand, there is also a need for non-technical roles to build dashboards.
IT/Dev Ops [Technical]
Jobs to be Done
I want to find anomalies in my environment so that I can ensure that my application network is performant
I want to use advanced querying so that I can tailor my charts and dashboards to my organizations’ use cases
Characteristics
They are primary responsible for the health of services and microservices across the application network, ensuring APIs are performant and efficient.
Typically highly technical
Majority users
Head of Integrations [Non-Technical]
Jobs to be Done
I want to explore metrics/create charts/create alerts without having to create a dashboard.
I want to easily create dashboards with existing charts in order to share them with my team, and collaboratively make decisions.
Characteristics
Not technical and pretty hands off. Head of integrations are usually collaborating with the C4E teams, needing dashboards to make decisions and share reports over time.
Typically non-technical, but usually have tech background
Minority users
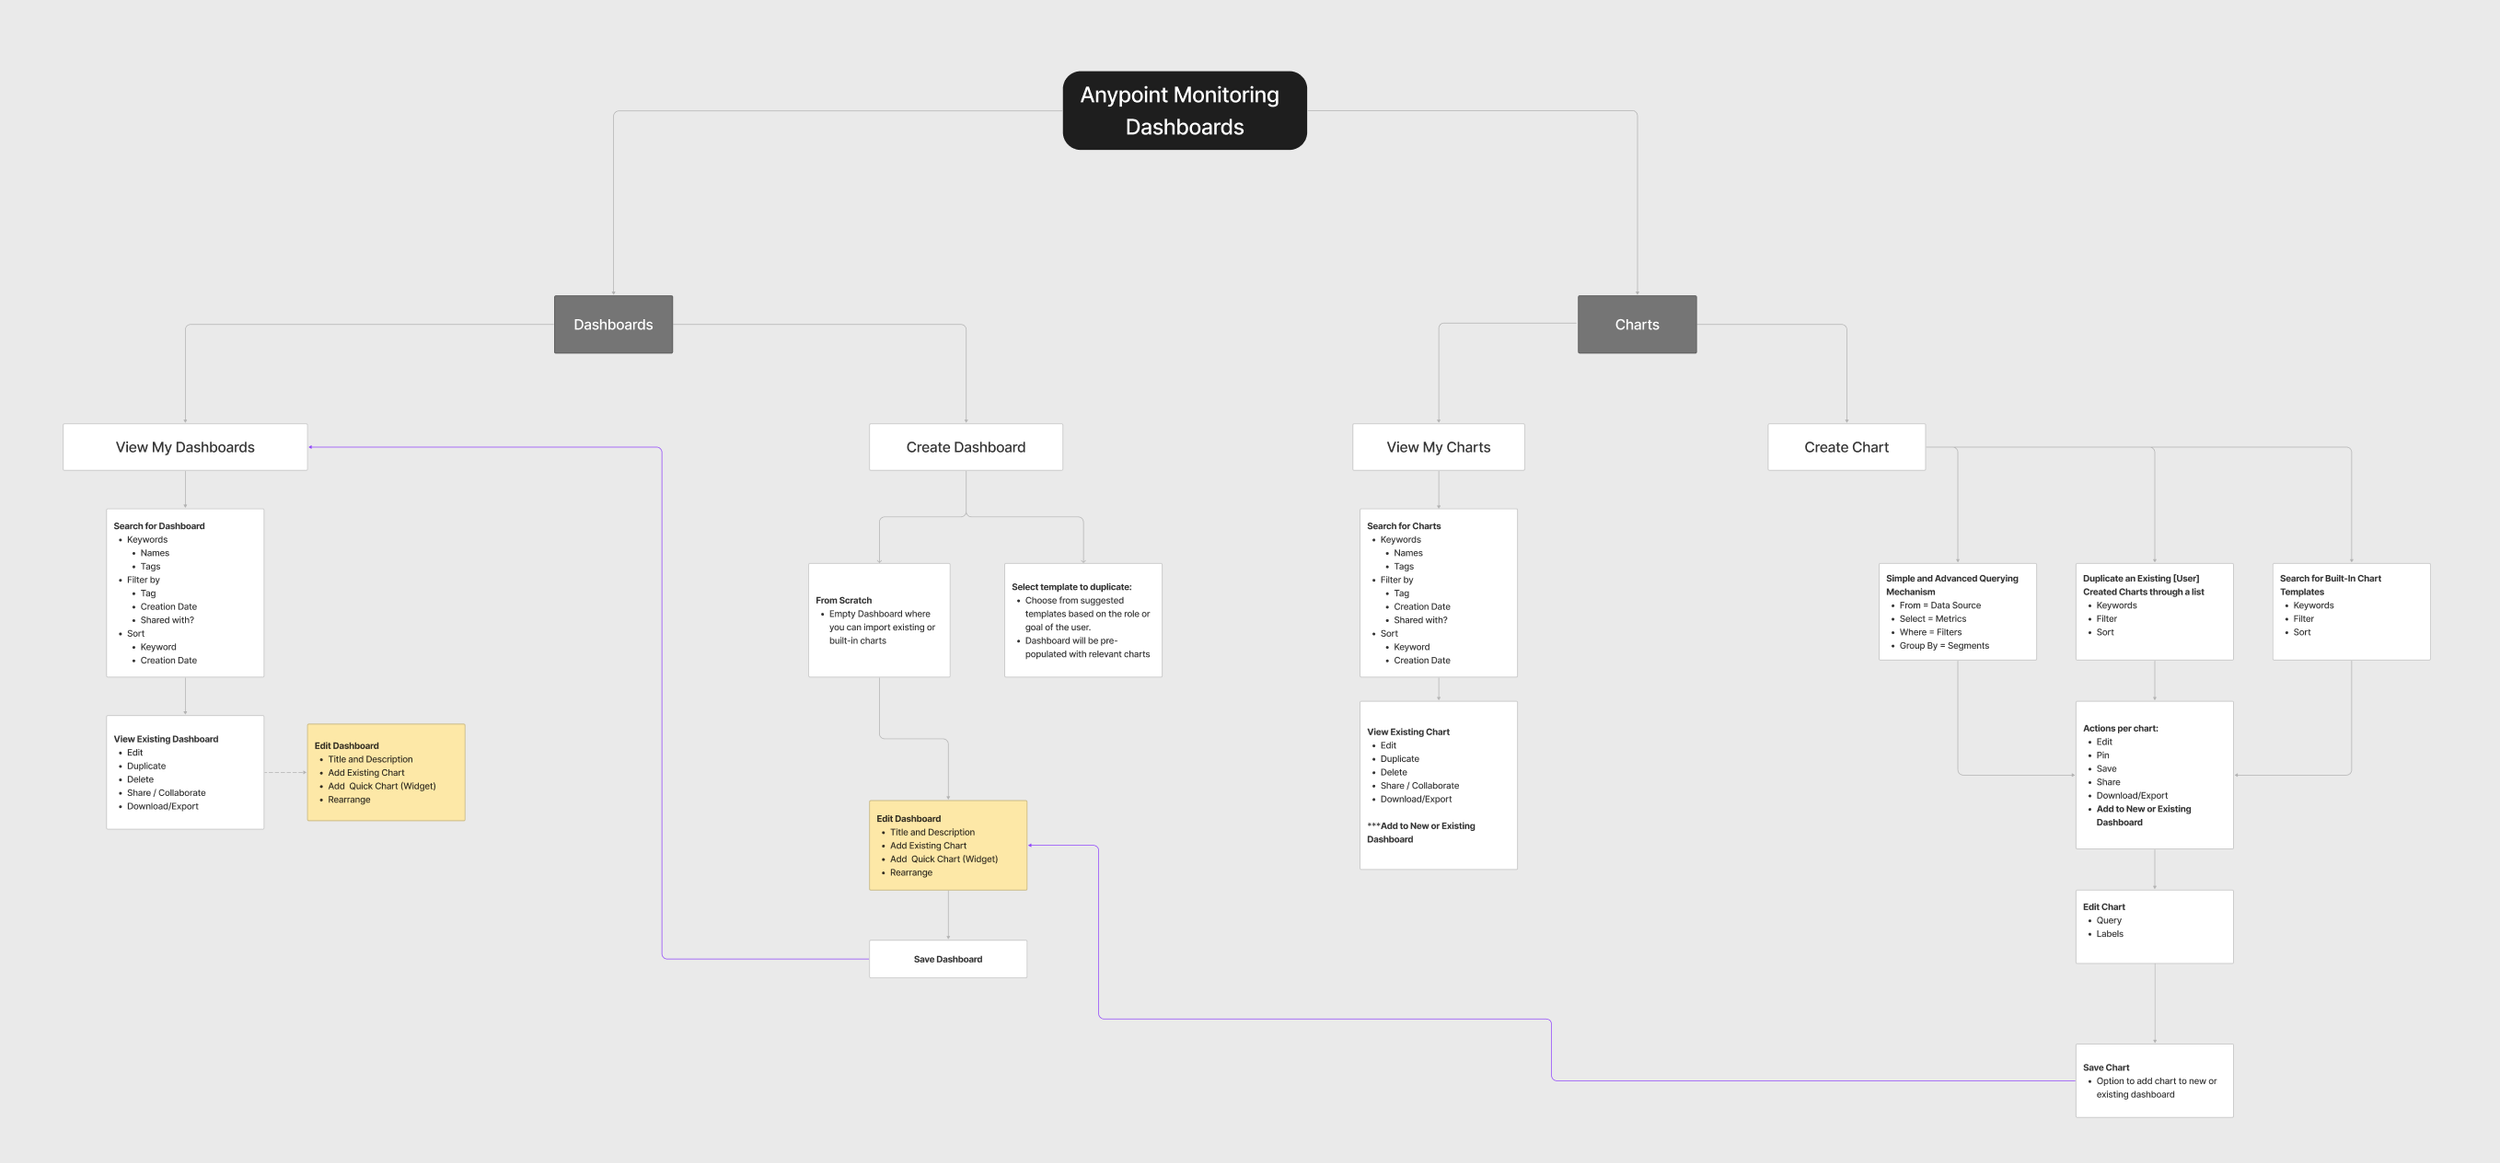
There are 2 mental models we need to support in the feature.
We learned that other than creating a dashboard, users also value being able to create a chart and explore metrics. This is extremely valuable for Day 0 users who are new to the platform. This was an exercise that I collaborated with my engineering team to align on how we could support both mental models.
Design and Iterate
After doing the product audit, I was able to come up with a couple of hypotheses about Custom Dashboards. It seems that the tool is valuable, but it isn’t accessible. Let’s also try to understand who are typically Dashboard users?
Iterations with SE team
Using wireframes, I was able to keep iterating designs with the SE team. We agreed that users would highly value and drag and drop interaction, taking into account the existence of already available dashboards.
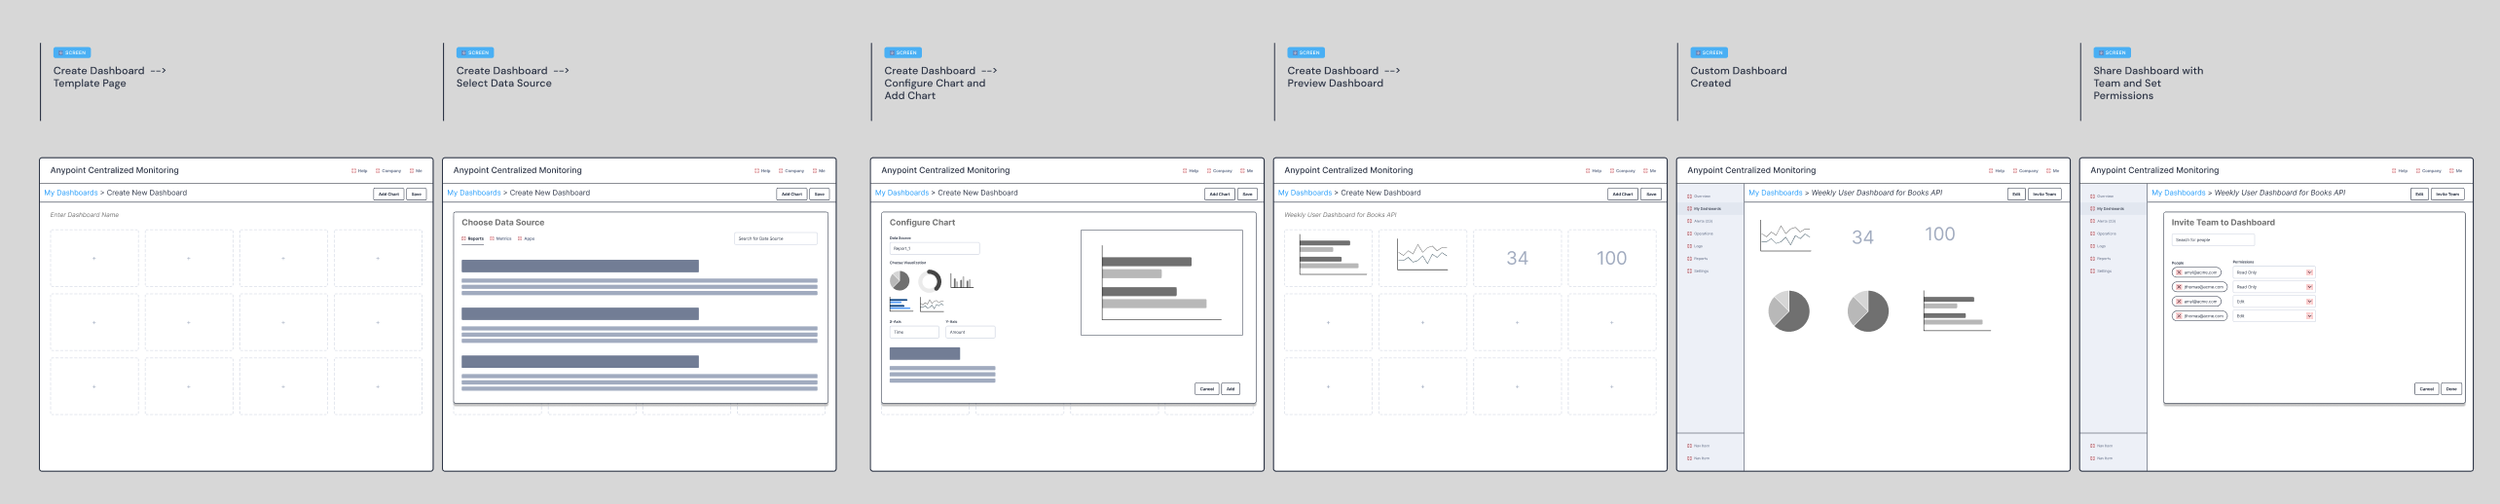
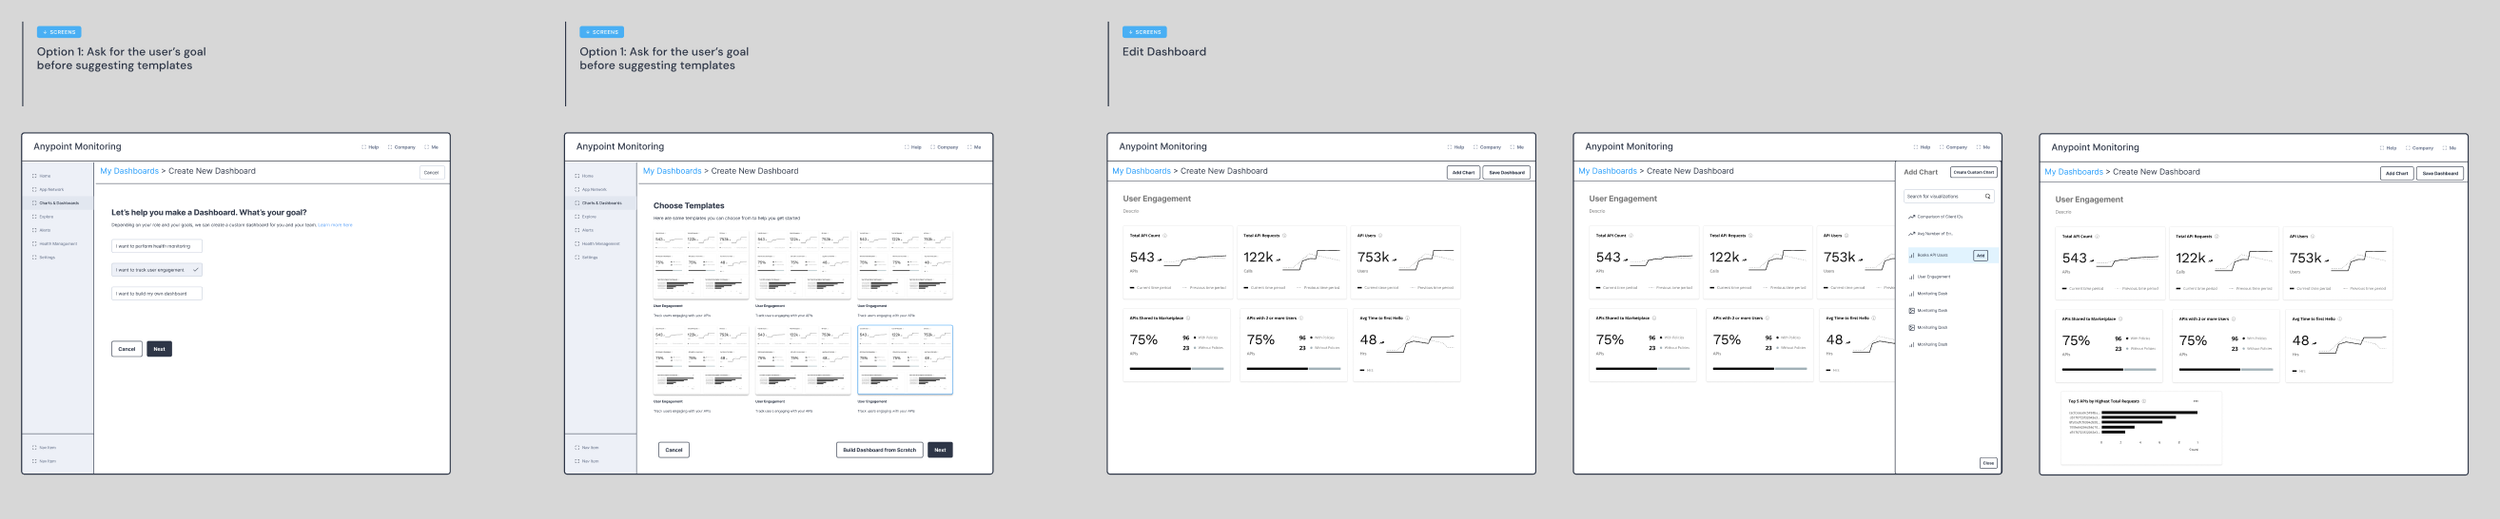
Hi-Fi Prototypes
After multiple iterations reviewed with the SE team and cross functional team, I created high fidelity prototypes to demonstrate the new user experience for Custom Dashboards. This product will be built out this year!
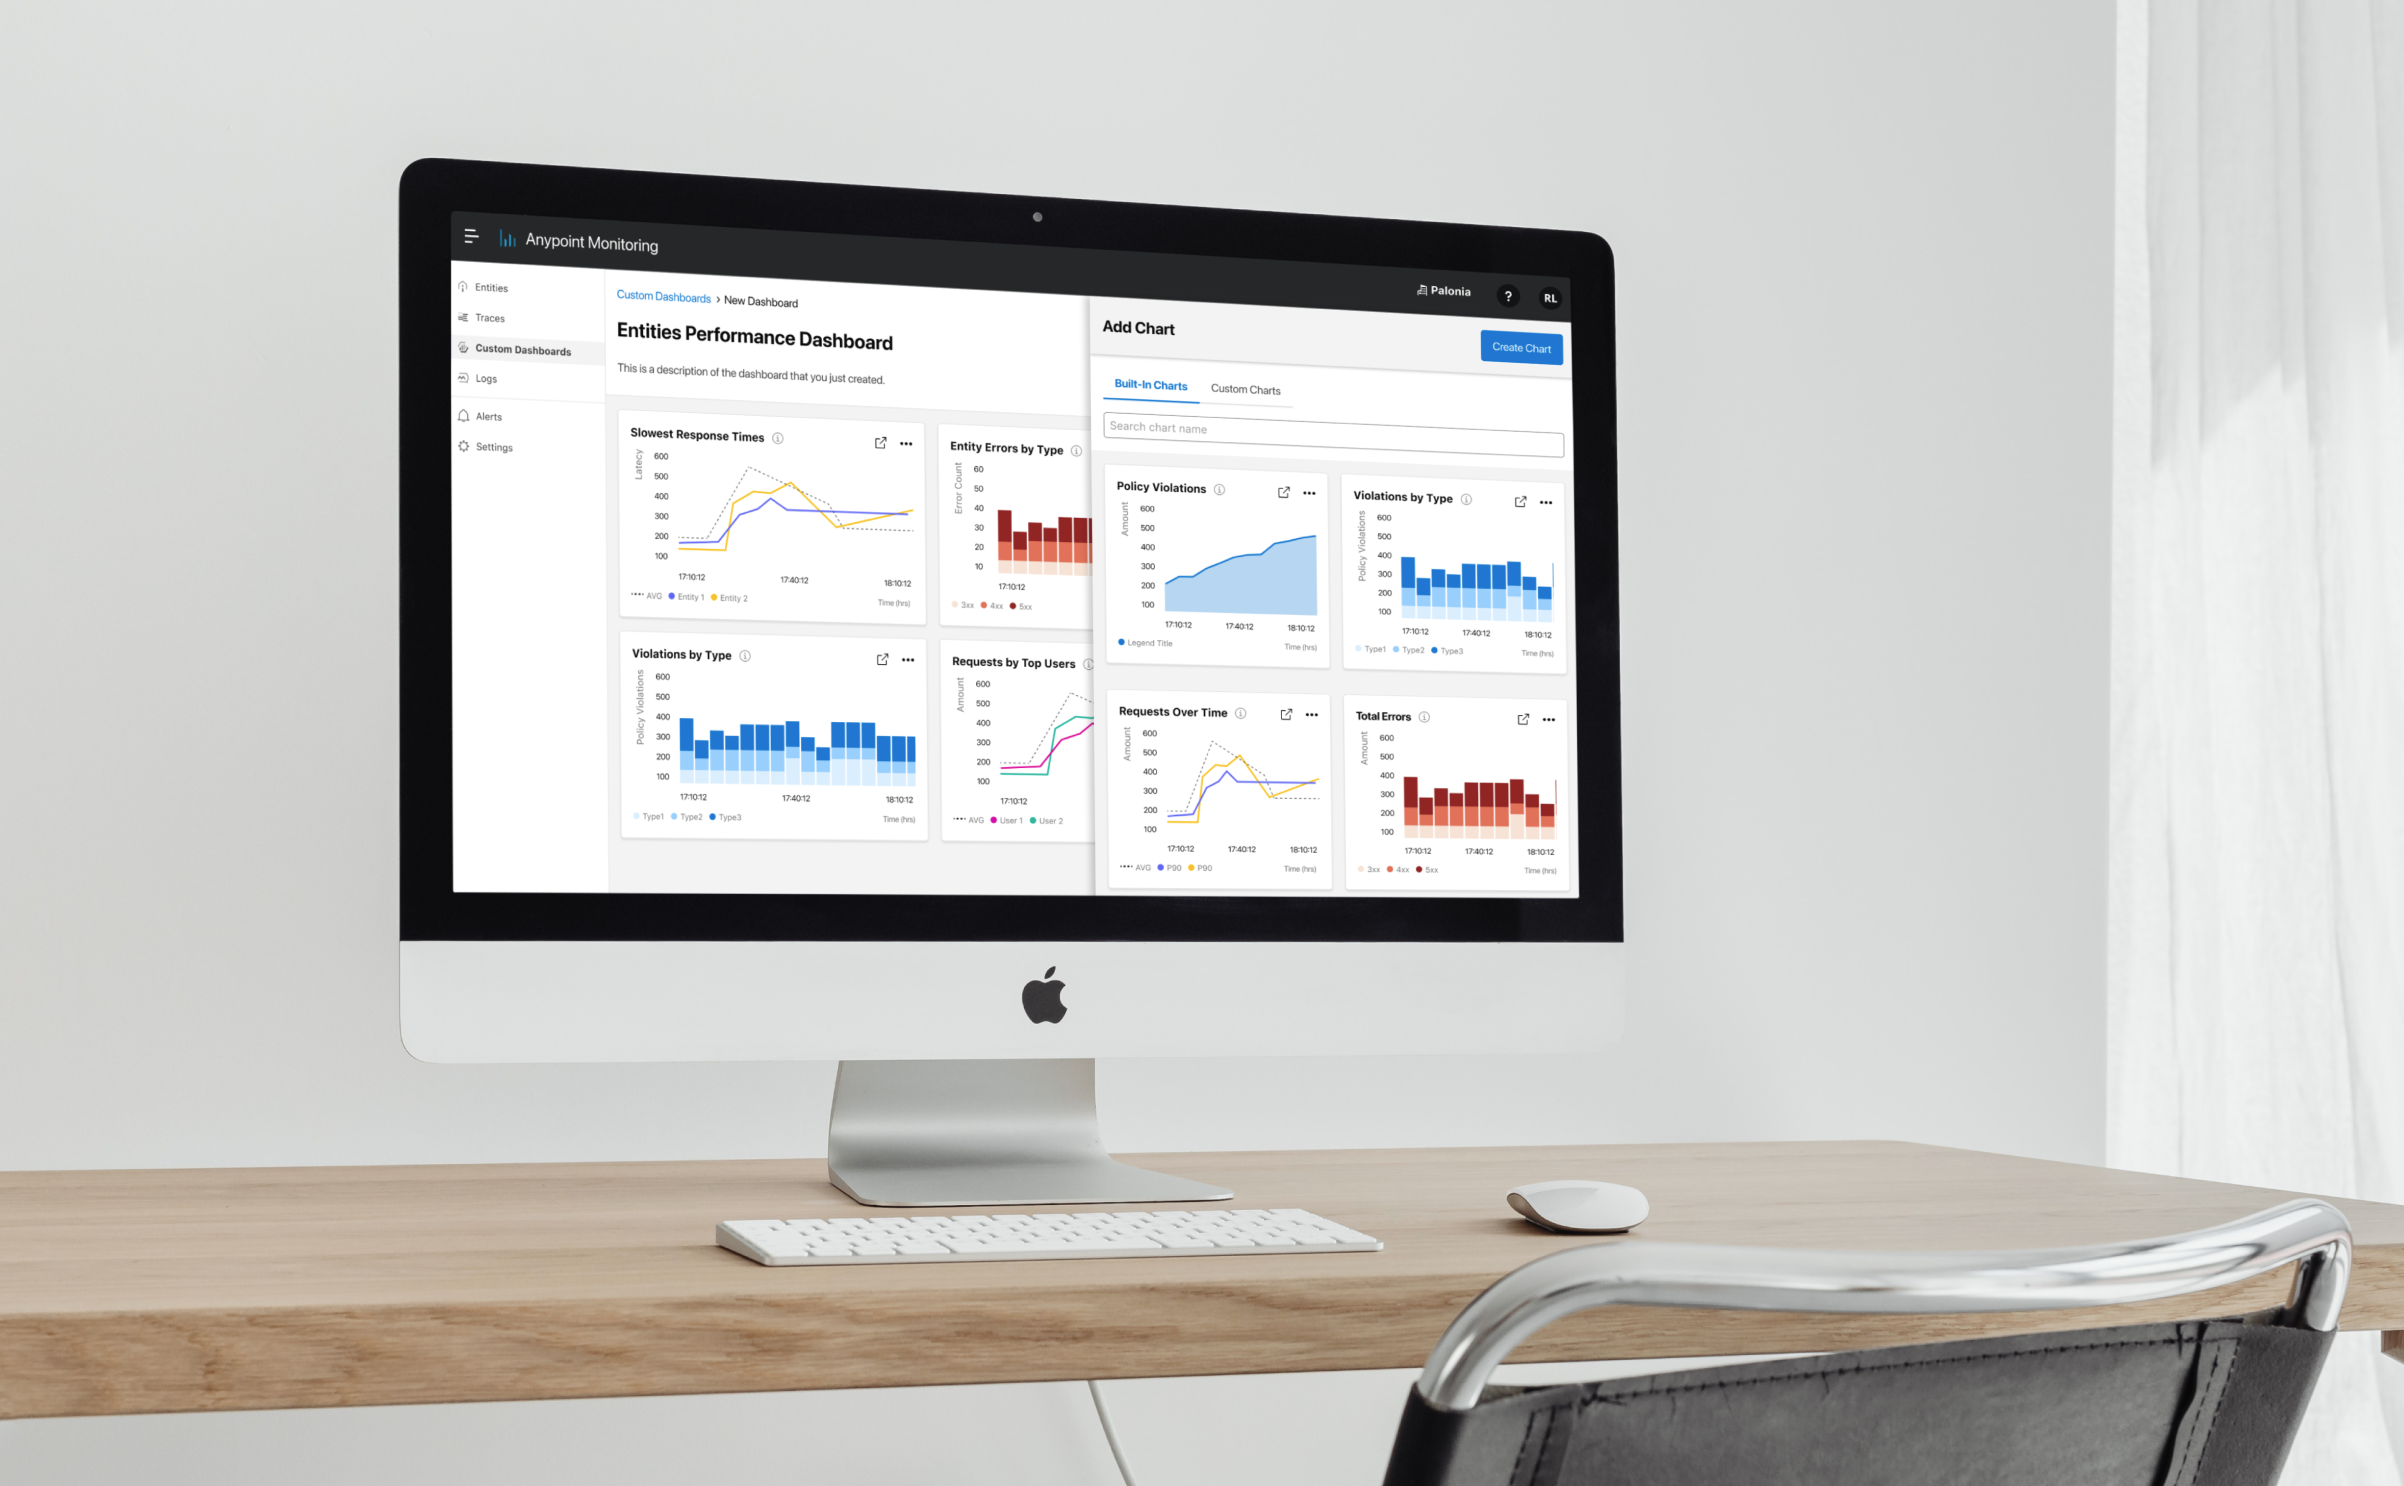
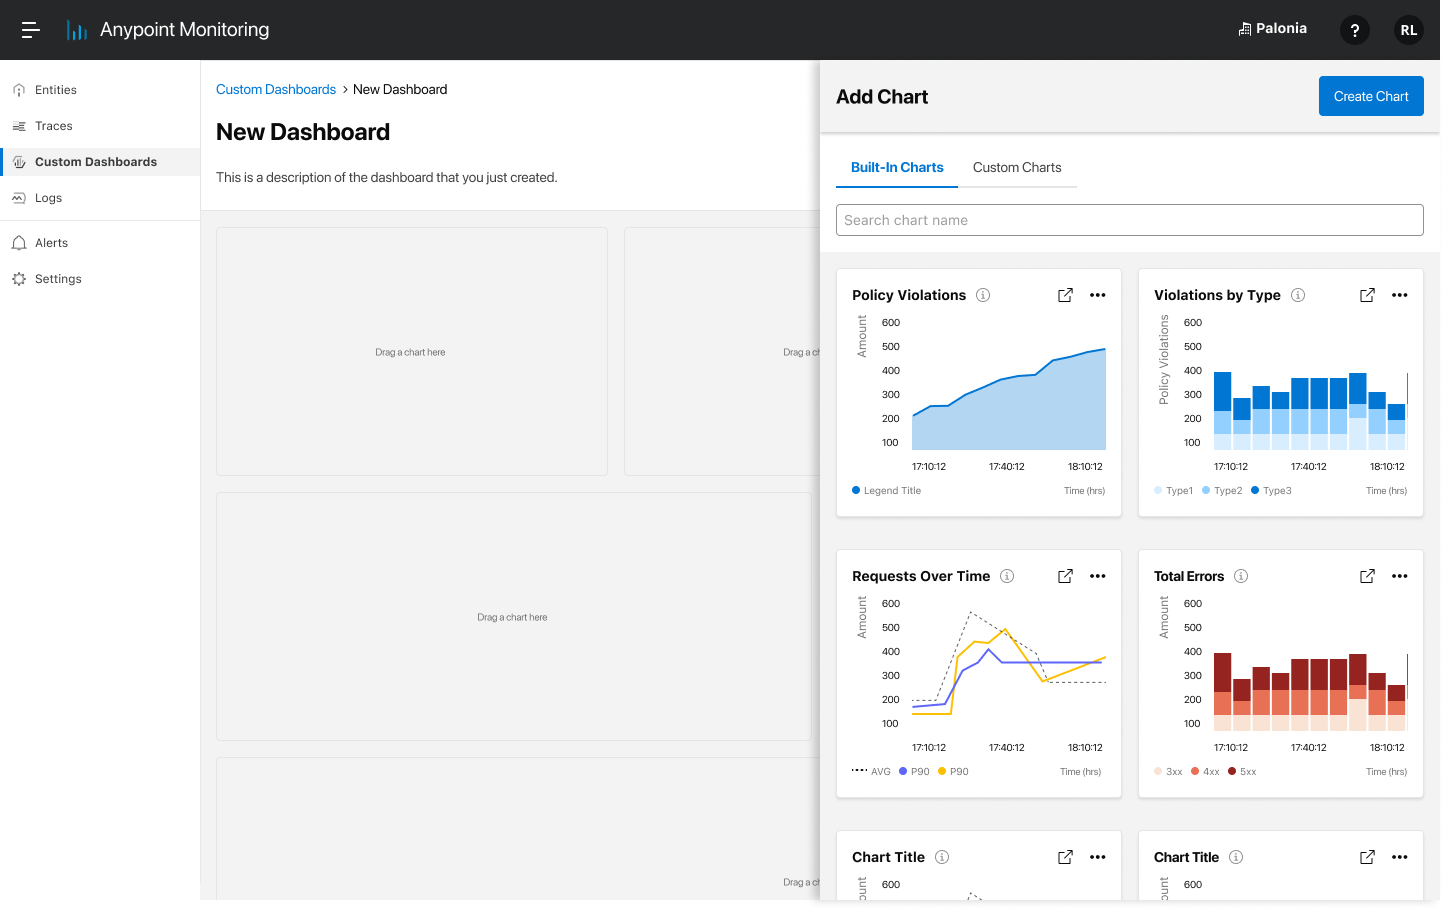
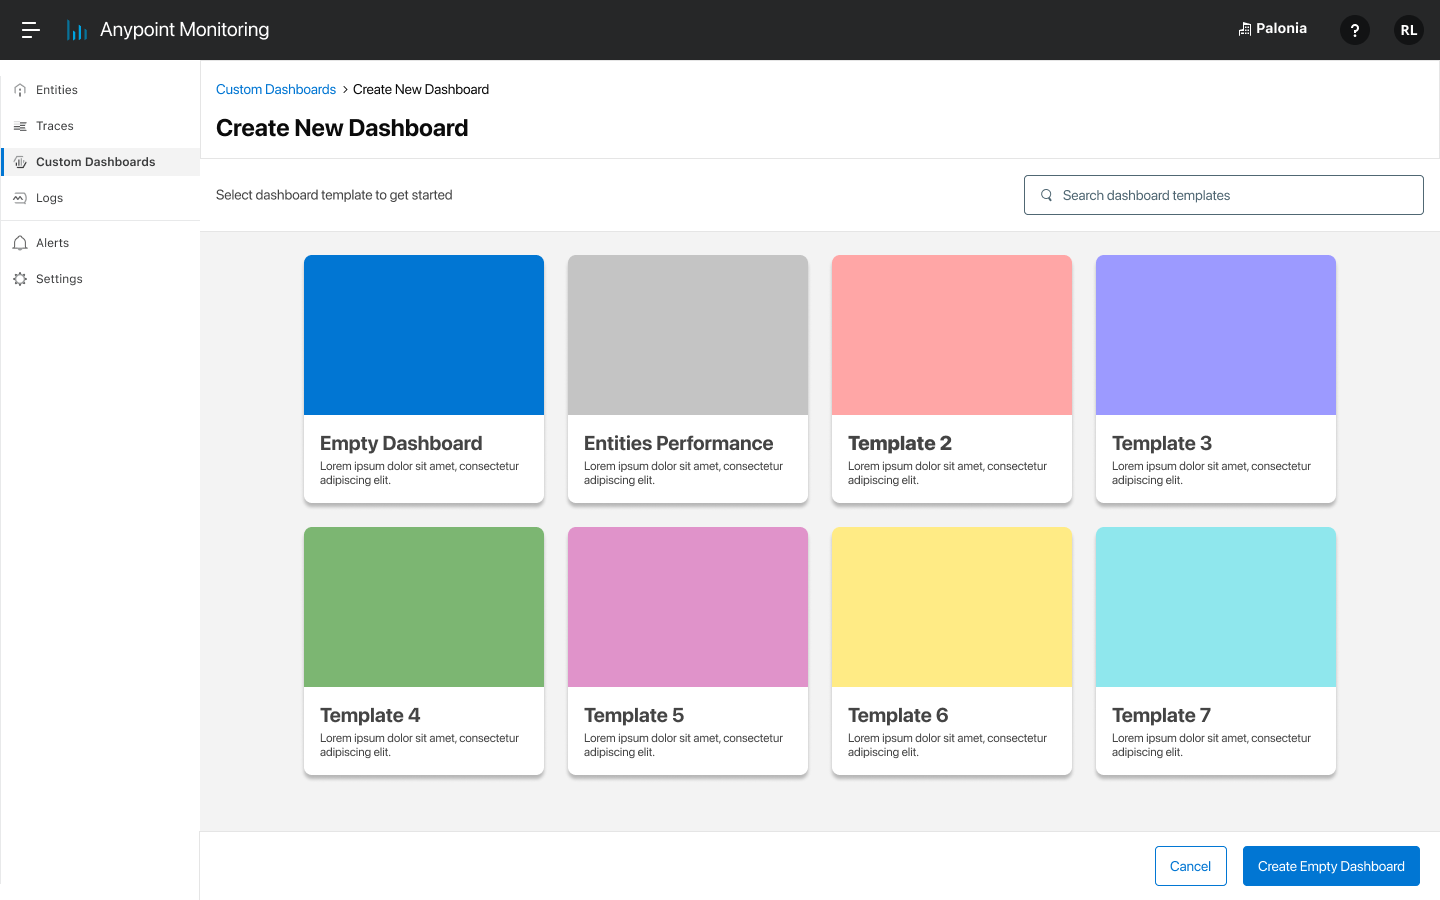
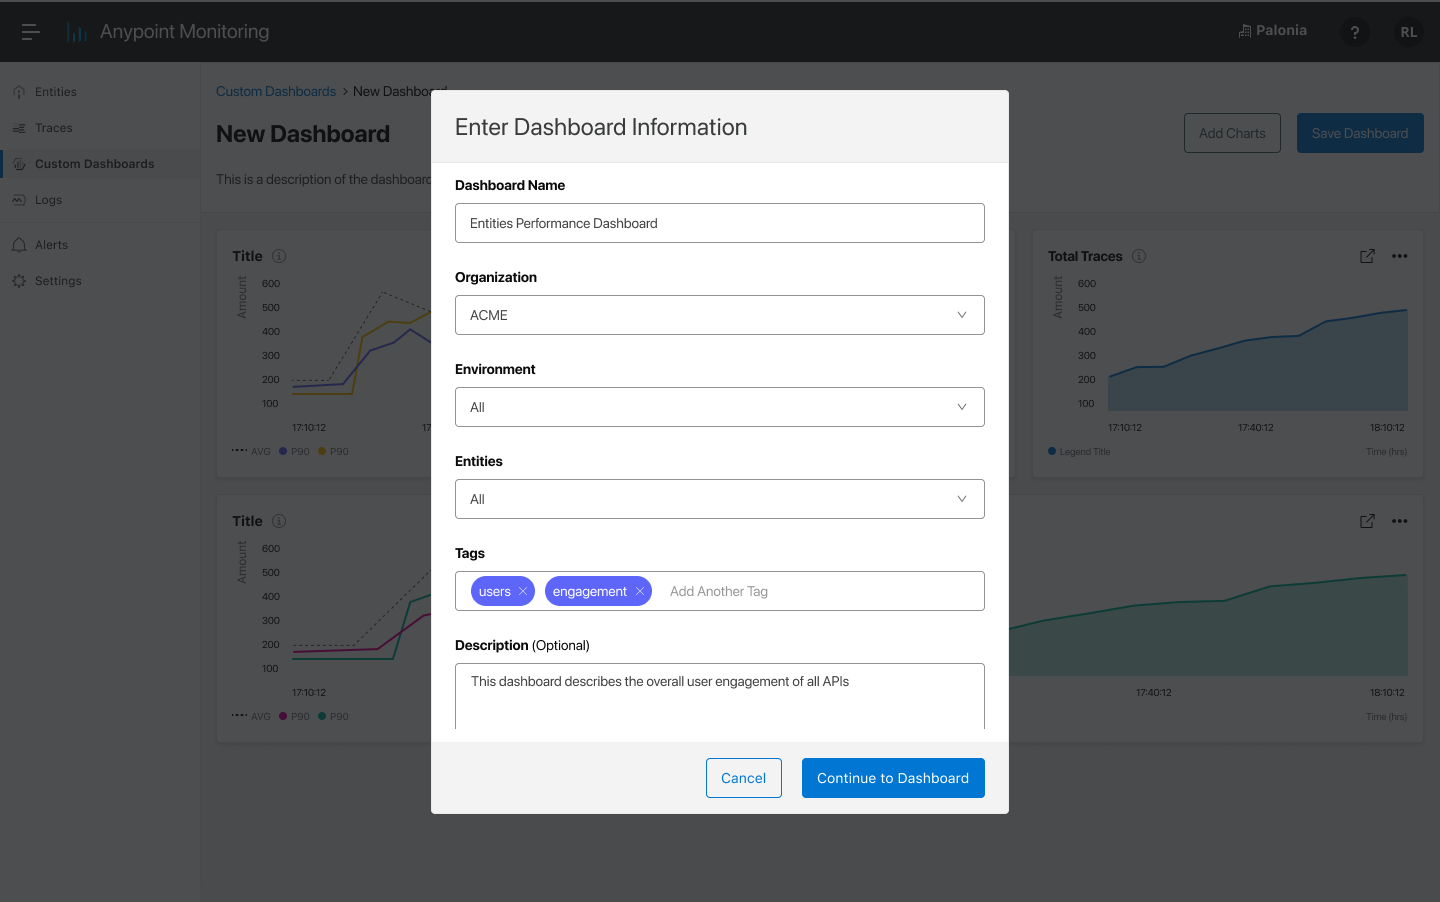
Create Dashboard
Users can either choose to create completely blank dashboard or select from a template. When they enter their dashboard canvas, they can add existing charts or add a new chart, where it will take them to a smart query builder.
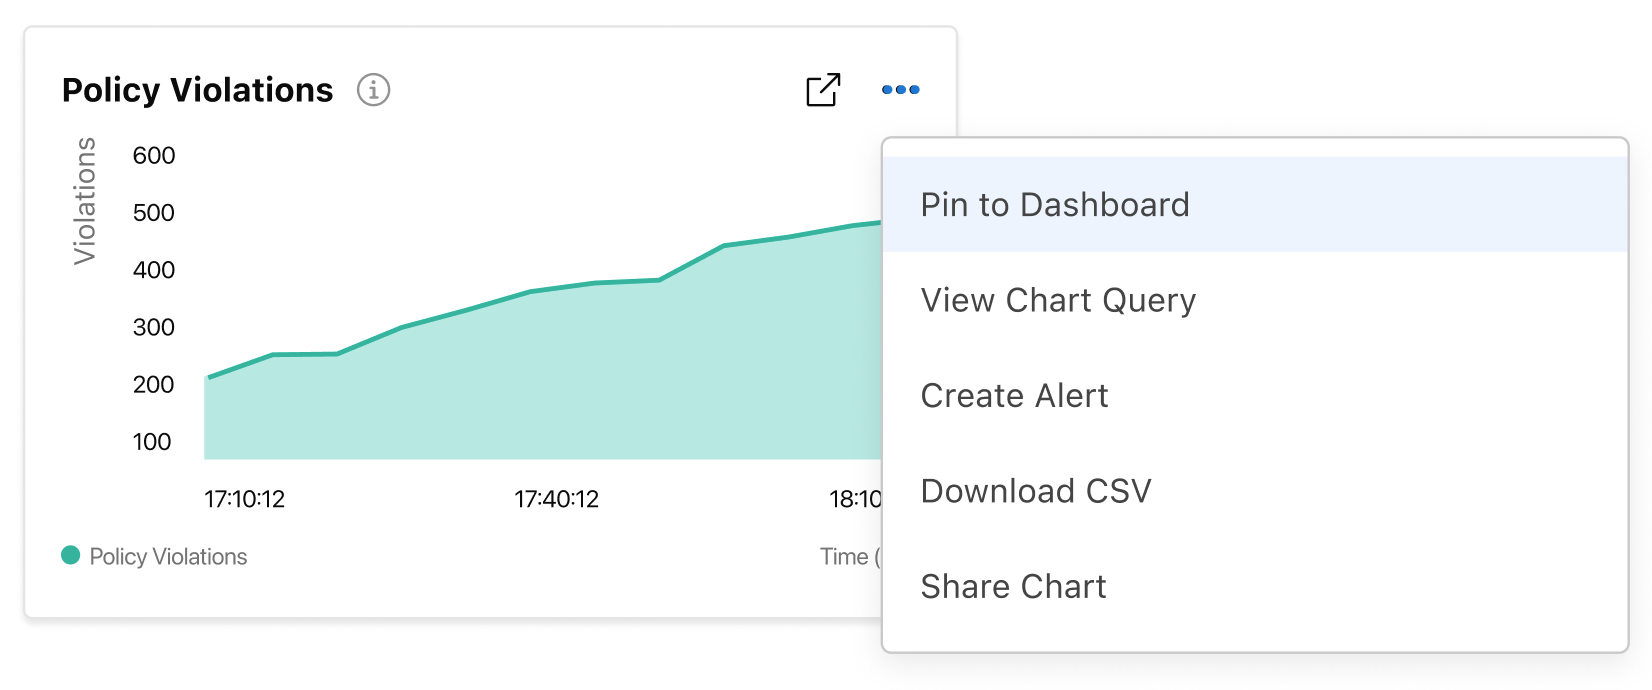
Utilizing Existing Charts
Anypoint Monitoring has many charts and dashboards across the platform. Some of our users want the ability to pin any dashboard to an existing or a new chart so that they don’t have to start from scratch.
Template Considerations
How might we templatize dashboards? All the user needs to do a select the type of template they want, and according to the template, we would ask them general parameters like organization, environment, and entities in order to generate an appropriate scope for the dashboard template.
Create Chart
Users can also create charts and explore metrics, without having to create a dashboard. They are given a list of metrics to choose from as a guide. By default, the query builder is on basic mode, which is suited for all users.
Guided Advanced Querying
For the expert users, an IDE-like format is ideal for query building, instead of general forms. Considering that there is a growing user segment of non-technical personas, I’ve decided to create a guided querying experience so that even novice users are encouraged to become advanced users.
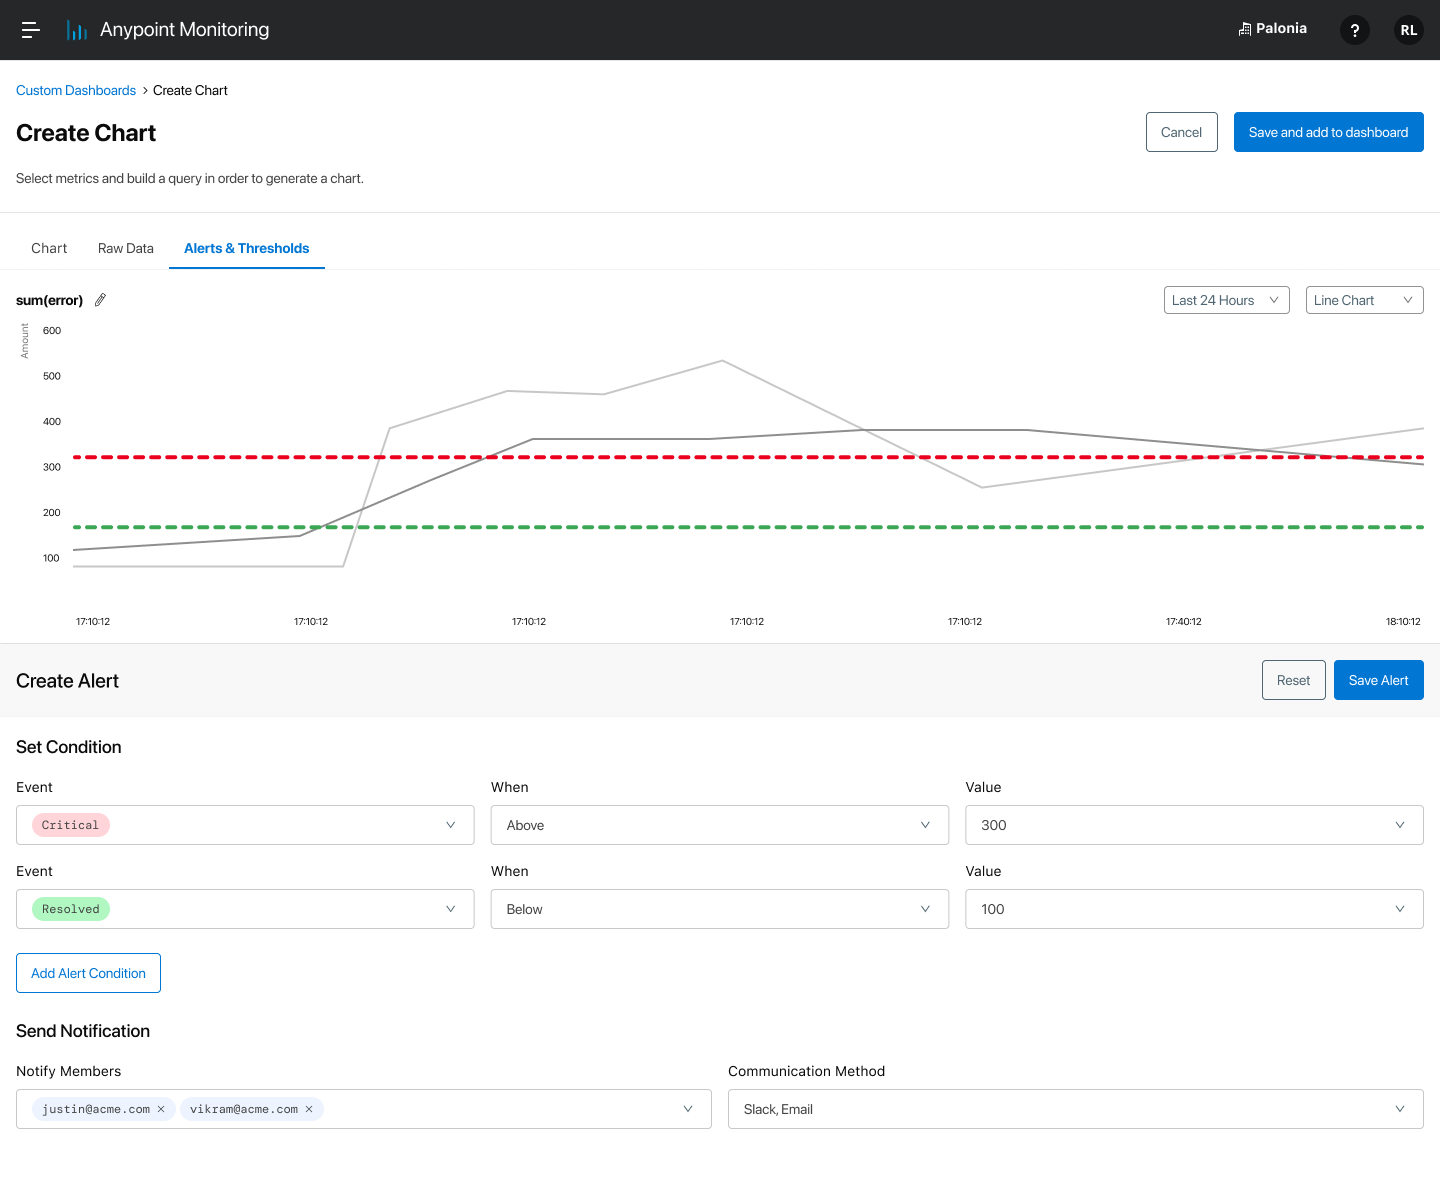
Embedded alerts in the future
It’s very common for our users to be able to create an alert after creating a visualization. Once they’ve generated a query, it is highly contextual to be able to also set conditions for which an alert might be created.
Key Takeaways
Involve engineers early and often so that everyone is aware of how the back-end infrastructure can support MVP, and so that engineers have an idea of what changes they need to make in the back-end ahead of time.
In big companies, getting feedback from internal teams can save some time in case we do not have access to broader/external customers.
In highly technical tools like this, wireframing is extremely important in conversations with engineering so that there is much more room to consider technical constraints and make changes.