Cortex Data Lake Platform Monitoring
A scalable data platform to help network and security administrators manage the ingestion, forwarding, and retention of their company’s firewall logs.
Role
Lead the end-to-end redesign of Cortex Data Lake, resulting in a reduction of mean time to resolution and improved observability experience.
Timline
Feb 2020 to Aug 2021

Problem Space

Being able to view firewall logs and having relevant log metrics are crucial for Network and Security admins. This is to ensure that the firewalls are working to protect the network. However, the current experience does not provide relevant log information to ensure that Firewalls are up and running.
UX Pain Points

Users have to do their own mental math to figure out if they are meeting their desired log retention goals. This only tells us the current state without the context of their desired retention. You can’t tell the difference between the “bad state” and “good state.” Customers don’t care about the storage so much. They care more about the retention days.
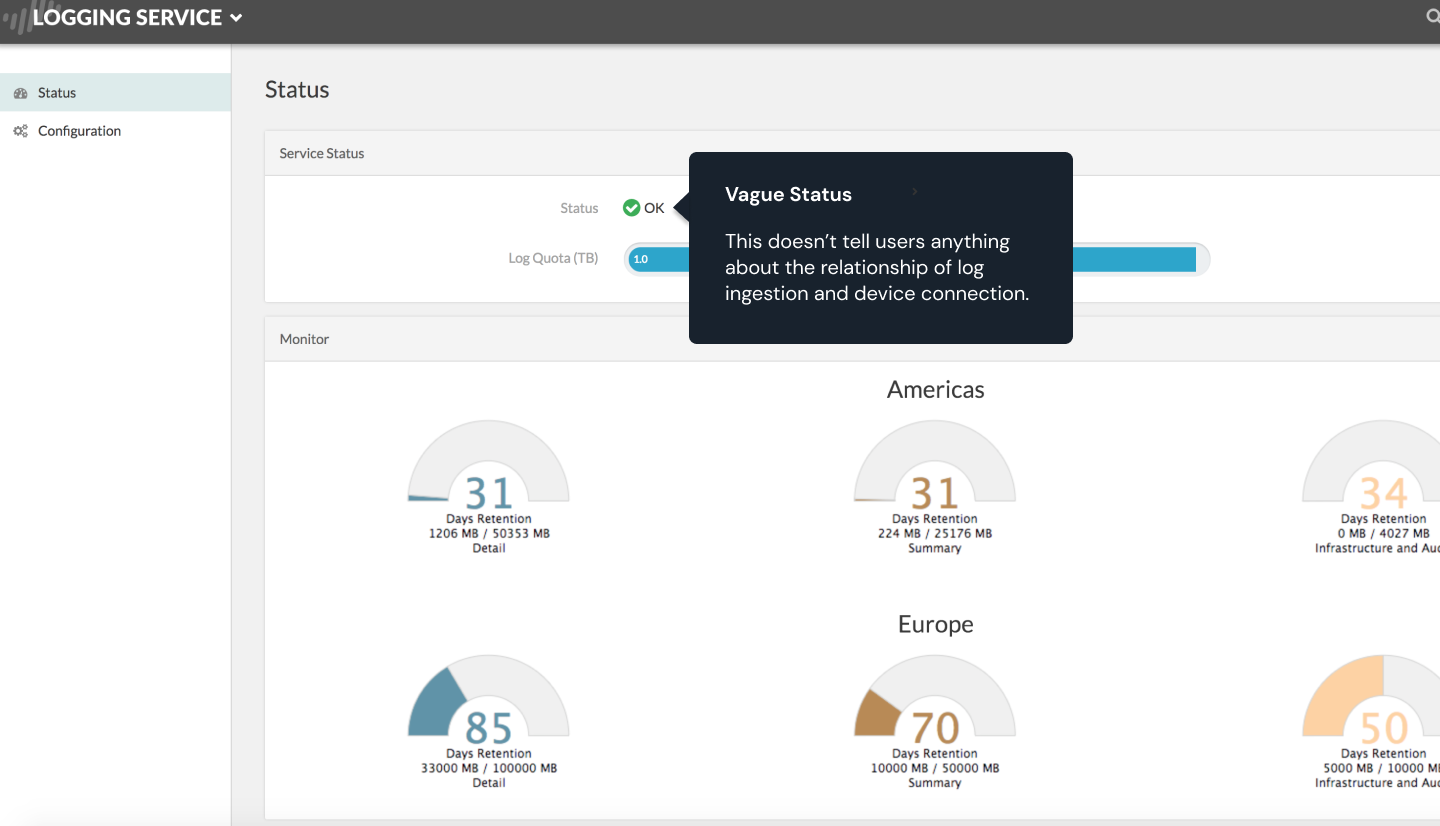
This doesn’t tell users anything about the relationship of log ingestion and device connection. For instance, there is no way to tell if logs are being lost due to a firewall disconnection. It’s important for users to understand how they came to this current state and there is no information that tells them why.

To view more in-depth information on logs, users must go to a separate app. For instance, they have to go to the Explore app to view their log trends, and the Log Forwarding app to forward logs.One might ask, why would I go to different apps to deal with log management. Wouldn’t it be nice if everything was combined and consolidated?This disjointed experience can cause a user to lose context and lose track of their troubleshooting flow.
Design Thinking
Troubleshooting User Journey Map
As a cross functional team, we mapped out a typical troubleshooting journey of a disconnected Firewall. In the old experience, the user would view logs in Explore App, which is an indirect way to figure out if a firewall was disconnected. The logging service app was practically, not usable.

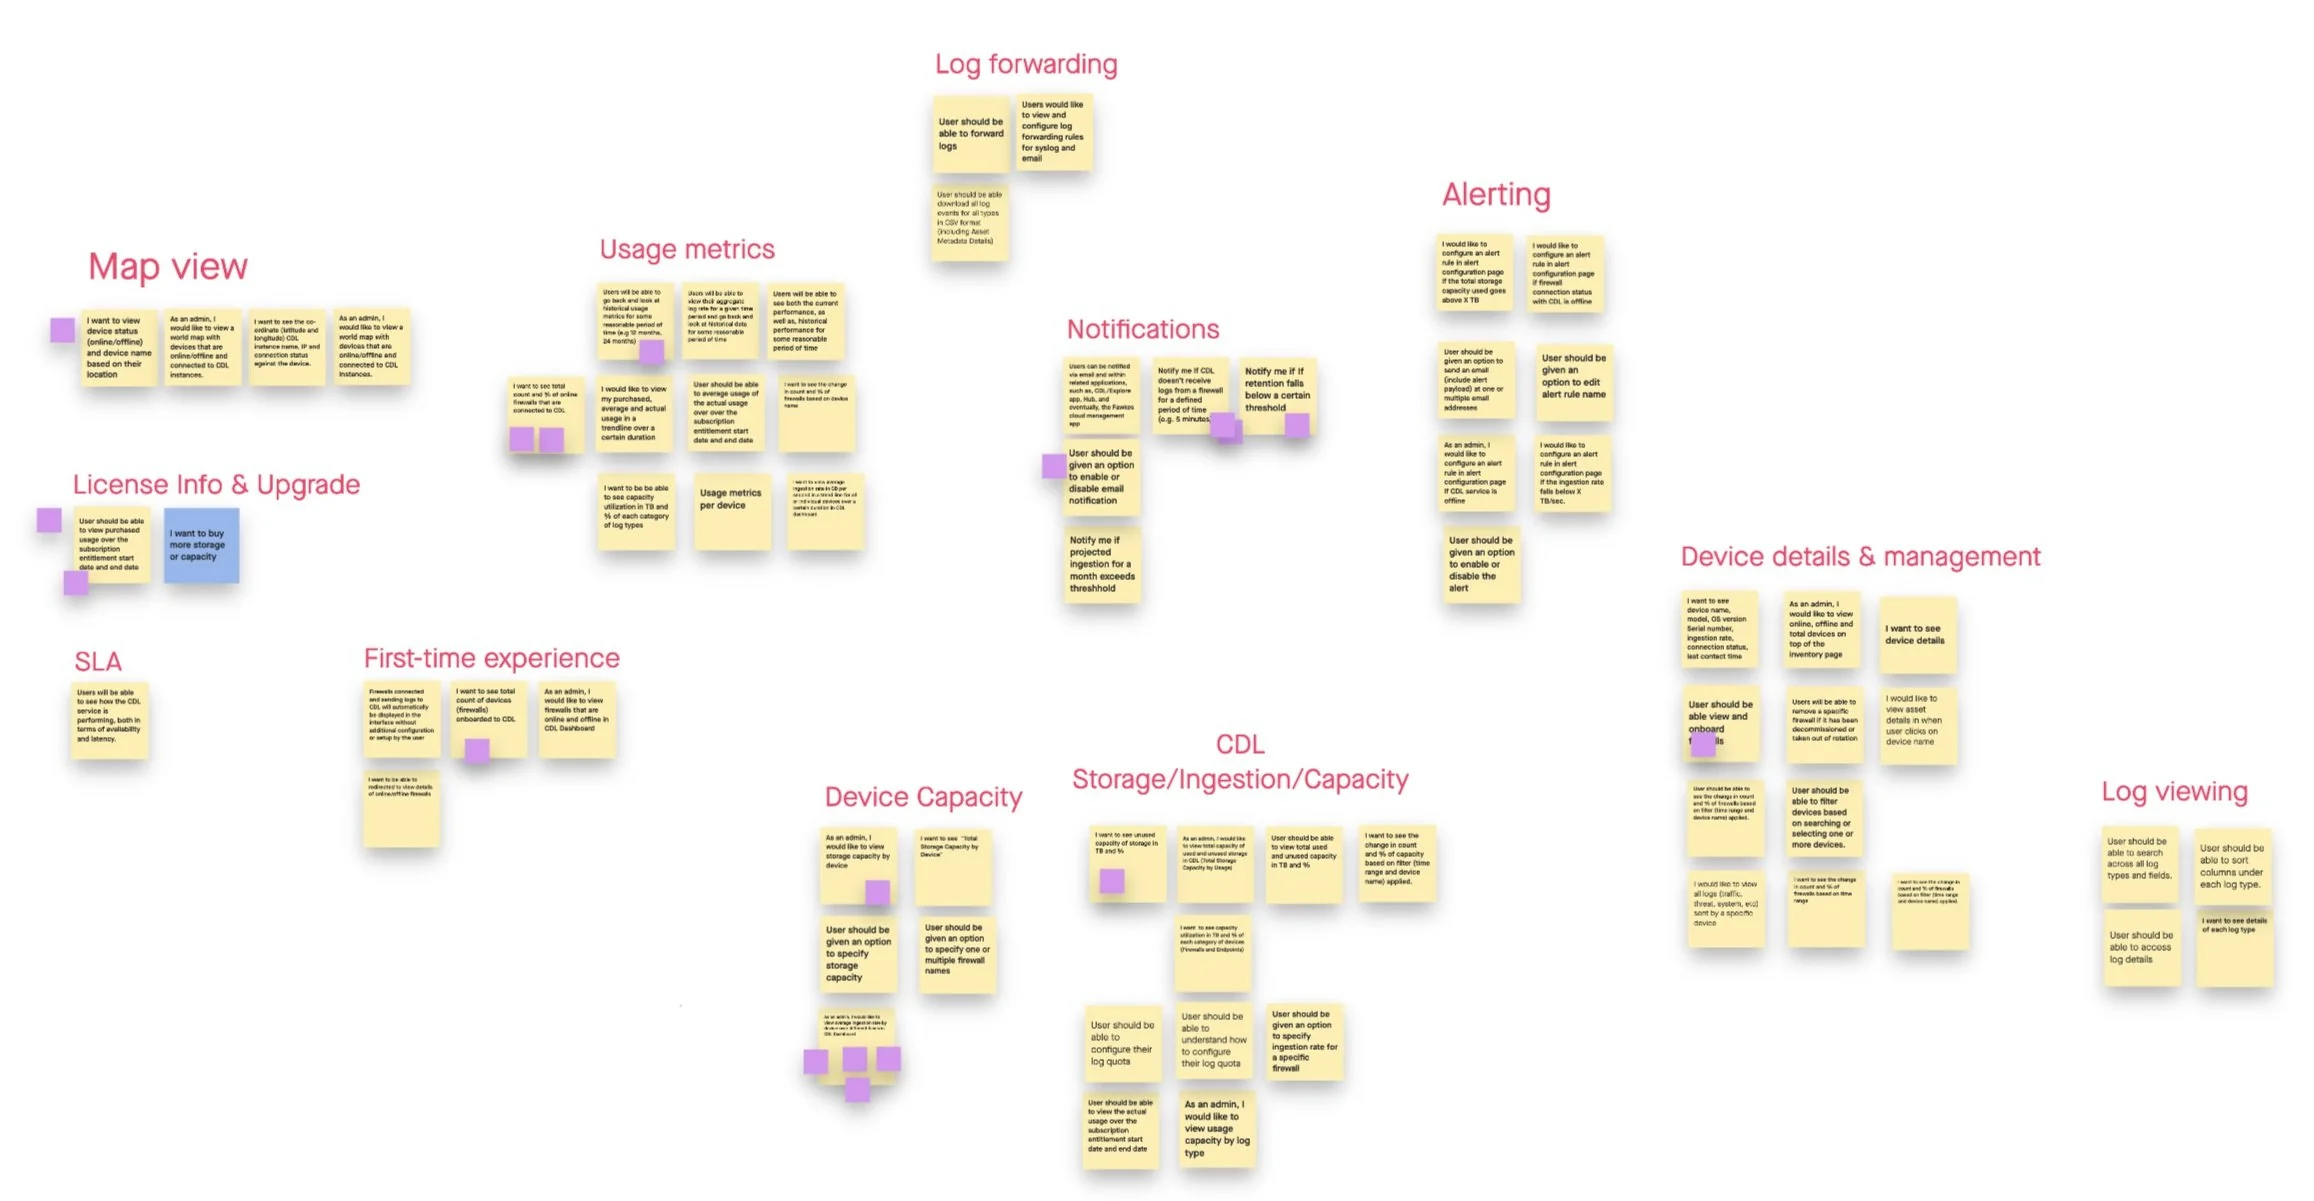
Affinity Mapping
I lead a workshop where product managers and sales engineers wrote down common customer needs that they’ve heard from interviews, and cluster them into relevant categories. At the end of this session, we voted on the features that should be prioritized. This helped us align on product goals, and it also helped me get a head start on how the information architecture could look like.
Sketching, collaborating, brainstorming
The previous activity gave me a really good idea on what things I needed to prioritize, and features I needed to design. This was a very large project, with a lot of requirements. I decided to break them down into parts and sketch out potential individual components. We had daily review sessions with our product manager and engineering lead. It helped us align on concepts, and be aware of any technical constraints.
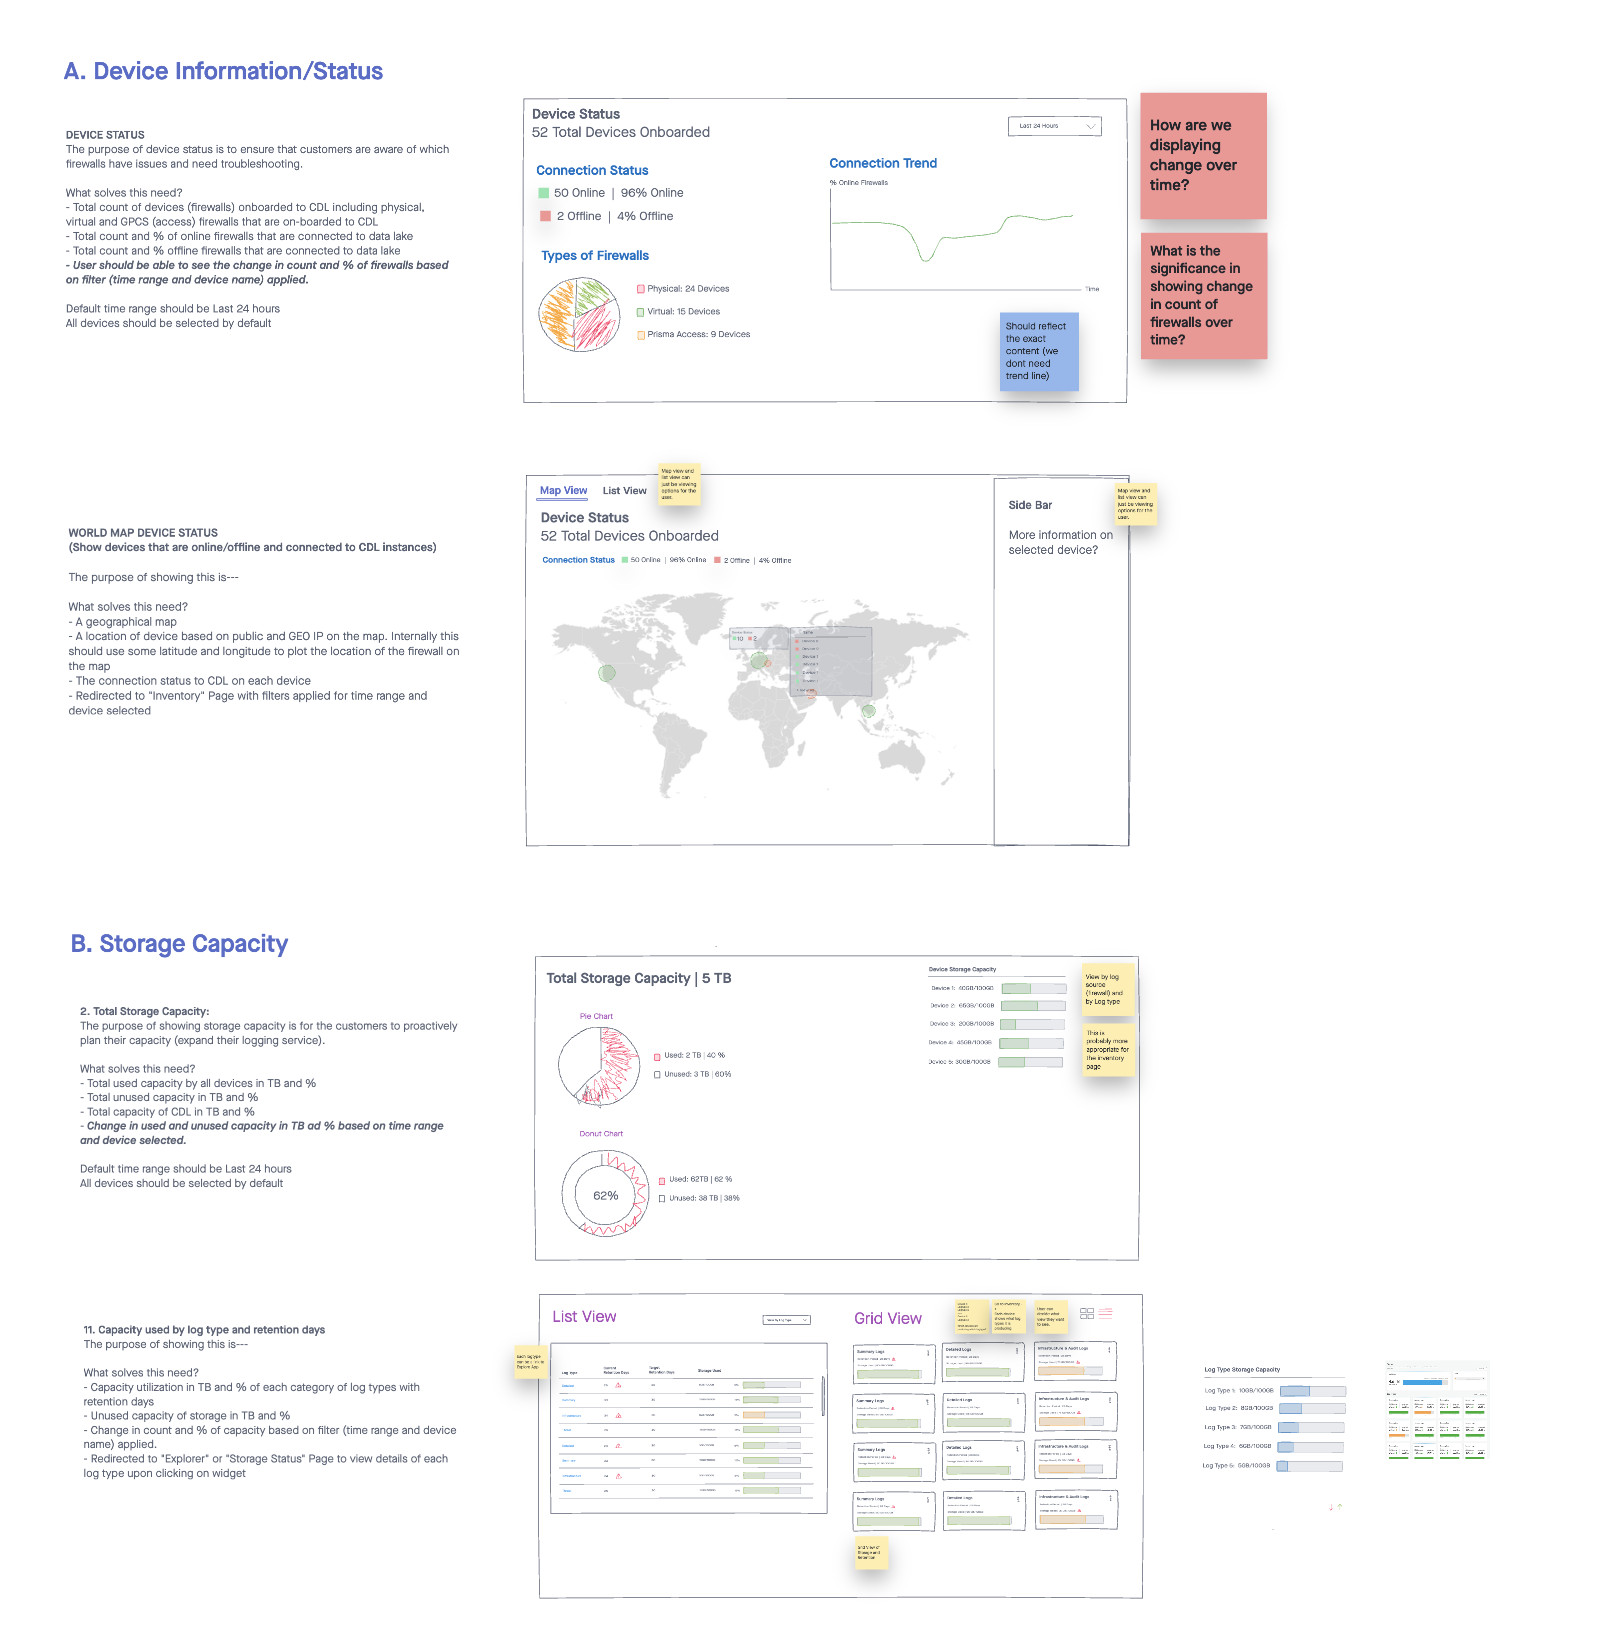


Iterations after iterations, we focused on
What metrics helped users the most
What charts effectively tell the story or solve the problem (the “telos”)
How much time the users will spend on this platform
Customer interviews eliminated our biases about what information we thought was important vs what customer thought was important. For example, in Layout 4, we had capacity usage chart (how many TBs used over time). Almost all customers we interviewed didn’t find this useful. Instead, they wanted the dashboard to show metrics that were particular to the ingestion and forwarding of logs. Through these interviews, we were able to nail down what they valued the most.

Design Solutions
Dashboard
The CDL dashboard is a one-stop-shop for security and network admins to quickly visualize the health of their Firewall logs and ensure that logs are coming in and out at a healthy rate. Through multiple customer interviews, we prioritized log metrics that would help the user make the most out of this dashboard.
Metrics Design
Connection Status
This is one of the most important widget on the dashboard. It shows how many firewalls are connected and disconnected, which is largely the cause of logs not being ingested. This also provides a way for network/security admins to keep track of firewall health.
Latency
The ingestion and forwarding latency is a metric that indicates “freshness of logs”. An increase in my ingestion latency means that there are delays in accessing incoming logs, and a decrease means that the logs are coming in and out faster.
Service Availability
Admins would also like to know the overall service availability, and what might have happened that could cause device disconnections. This is where they can see that there was a service outage in the last 24 hours.
Log Rate
Admins would also like to know the average logs being ingested and forwarded during a given time. Again, this helps them determine the health of firewalls
Log Type Table
The breakdown of log types provide a way for admins to know if they need to buy more log quota or adjust log quota.


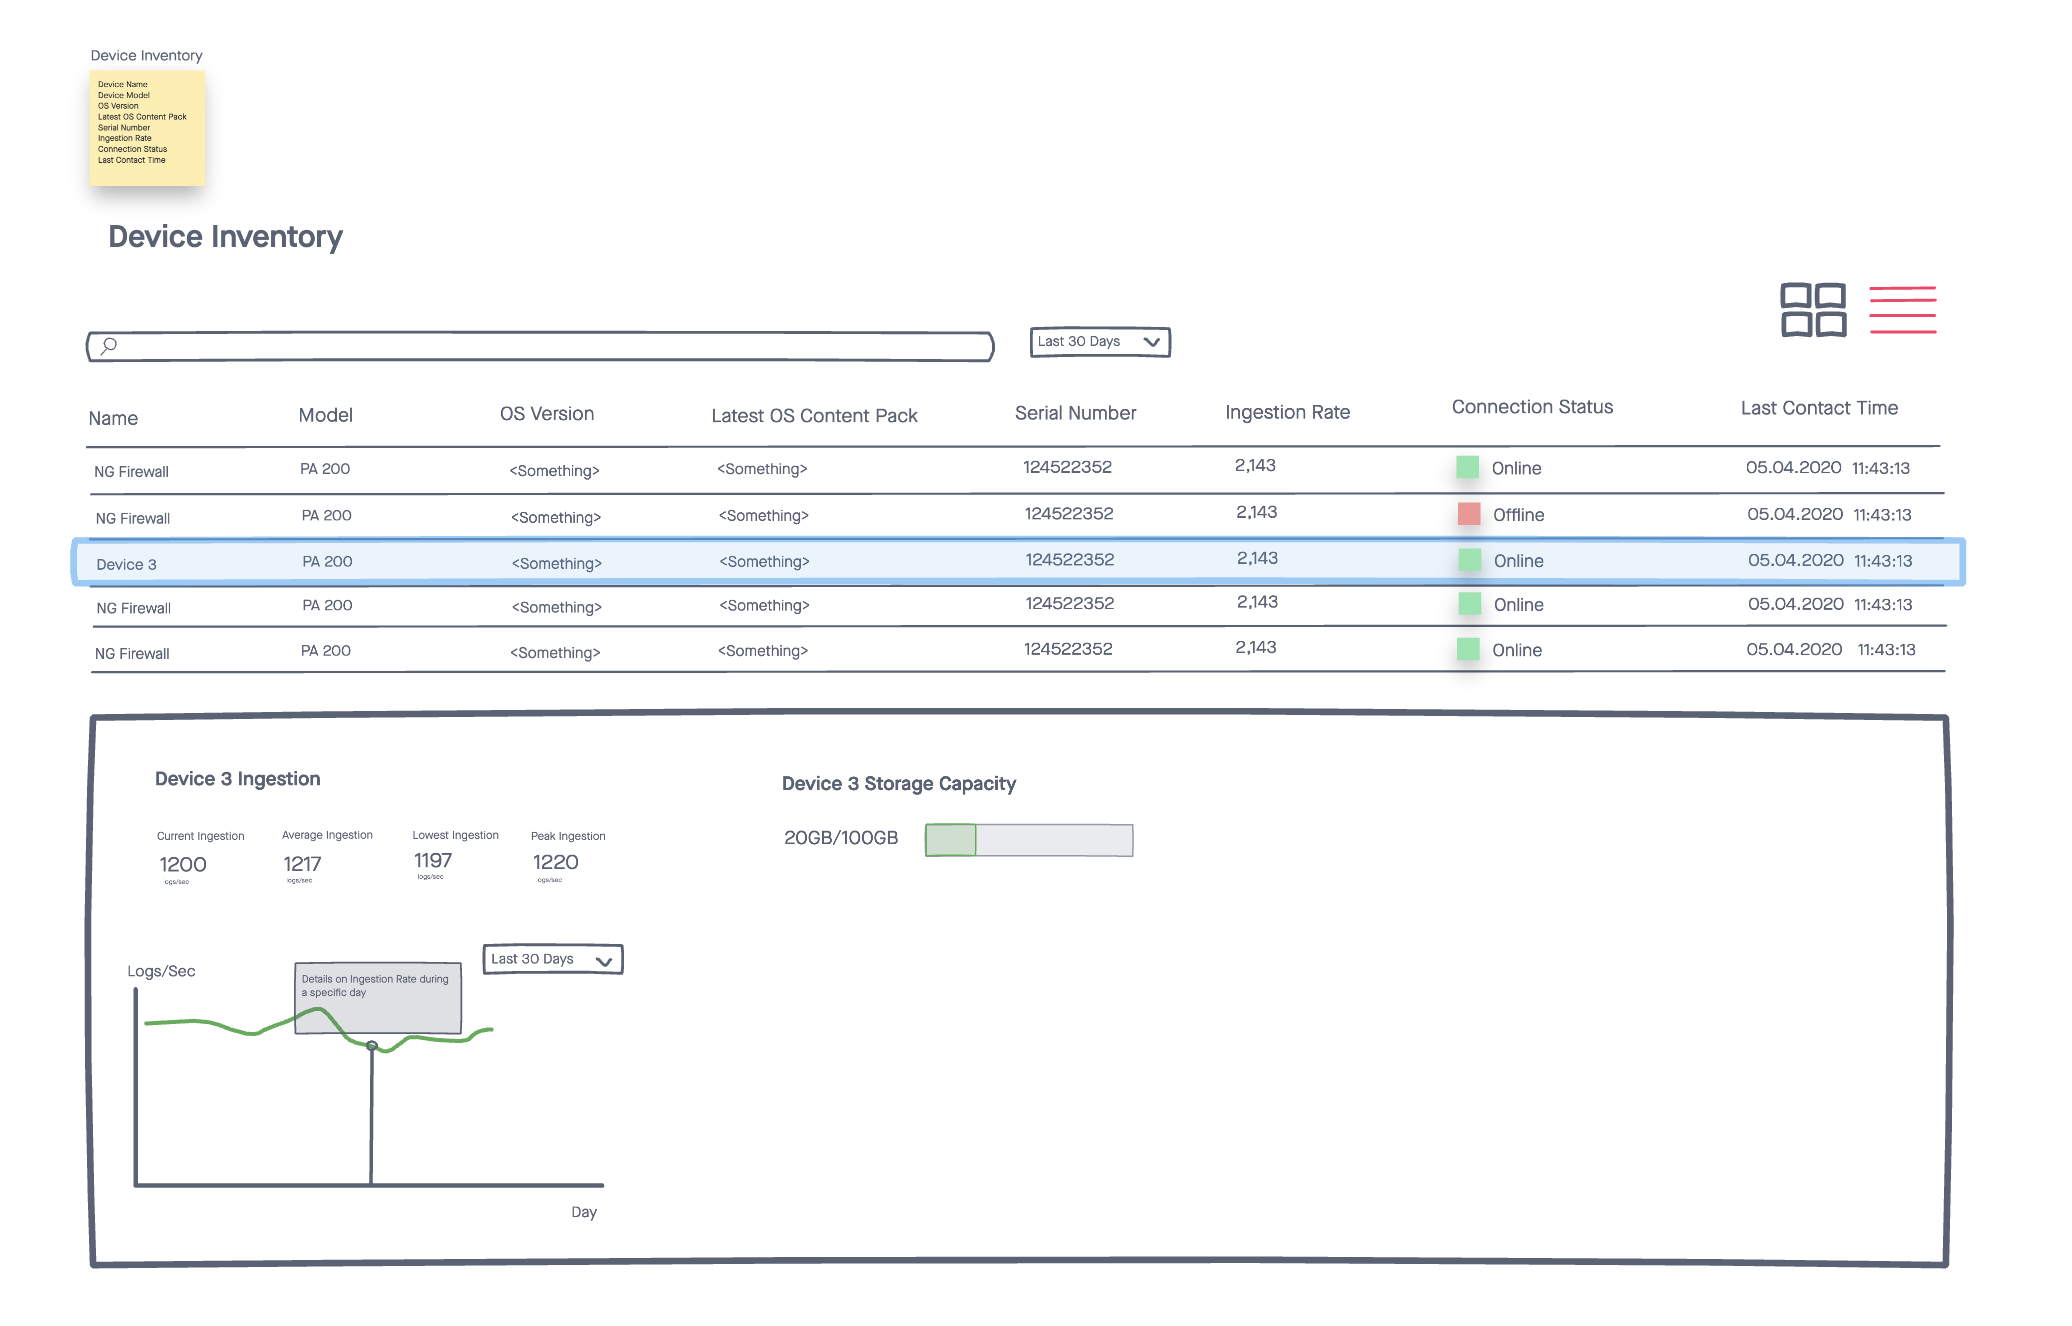
Firewall Inventory
The inventory page is a way for network and security admins to take a closer look at each Firewall in the network.
Each and every firewall’s log data is now consolidated into this page, and they can see each firewall’s connection history over time.
Easy Firewall Onboarding
Users can also easily onboard new firewalls into Cortex Data Lake using this quick onboarding flow. This is a major improvement to the previously complicated experience that required switching between 3 applications.
Reduced Jumps in Troubleshooting Journey
Now the user can do most of their troubleshooting within the Cortex Data Lake app, since all of the important log and firewall metrics have been consolidated in one platform.

Results
Eliminate the need to go to Explore App + Panorma to detect disconnection). All log metrics are now consolidated into one place, which saves a lot of troubleshooting time.
Reduction in the number of support calls generated from lack of log metrics.
Being able to see latency metrics helps users evaluate the freshness of log data ingested into FLS. This was a highly requested feature by customers.
Lessons
You can work with very little data about your customer by getting the right people in the room.
Work with your engineering partners everyday to see what is possible, and to reduce design debt.
Involve your stakeholders (including QA) in brainstorming, design activities, and design review sessions. This is for better cross functional alignment and avoid surprises.